
Profiling Python Extensions with callgrind
At some point in the development of a high performance Python library, you will likely find yourself writing C/C++ extensions (whether by hand or via Cython). That alone may achieve the performance you desire, but in cases where you still need more what do you do? The Python runtime won’t be able to track the performance details of any lower-level extensions, so many of the great tools used for Python profiling are out of the question. Instead we need to opt for profiling tools that directly target C/C++ executables.
There are many tools to help with this, but for this article we are going to use callgrind, which is part of the larger Valgrind framework. As a profiling target we are going to pick the 1.5 release of the pandas library, where we are curious to know which parts of the read_csv implementation may be a bottleneck.
Setting up our environment / data
To simplify the setup I have created a Dockerfile custom-built for this article, which you can pull via docker pull willayd/blog-posts:pandas-callgrind. If not using Docker you will need to install Valgrind alongside all of the pandas build requirements from the 1.5.x release.
You will also want to get a copy of the pandas 1.5 source code local to your computer. For this article we assume that source code will exist in a local directory named ~/code/pandas-1.5. We will also checkout a particular commit to prevent any future changes made to 1.5.x from rendering the solution in this article incompatible.
willayd@willayd:~$ mkdir -p ~/code
willayd@willayd:~$ git clone --depth=1 -b 1.5.x https://github.com/pandas-dev/pandas.git ~/code/pandas-1.5
willayd@willayd:~$ cd ~/code/pandas-1.5
willayd@willayd:~$ git checkout 778ab82
For data we can use the US Census 2020 SUSB Annual Datasets by Establishment Industry file, which contains this raw data. Save the raw data to a file name us_state_6digitnaics_2020.txt located in ~/code/pandas-1.5.
At this point we have data and the supporting files we need. If using docker, start up your container with docker run --rm -it -v ${HOME}/code/pandas-1.5:/data -w /data willayd/blog-posts:pandas-callgrind.
Building pandas for use with callgrind
In the simplest of use cases, we can follow the standard pandas instructions for building the library and run it via callgrind to get a high level summary of which functions are taking the most time. However, we can do better and get line-level profiling if we compile our C extensions with debugging symbols.
If you worked through my previous article on debugging Python extensions you would have seen us do this directly via gcc by passing the -g3 flag. In our current use case with the pandas code base, we follow their documented instructions for debugging C extensions in pandas and instead use a --with-debugging-symbols flag. Both ultimately get us to the same place.
root@90e75e54ee98:/data# python3 setup.py clean --all
root@90e75e54ee98:/data# python3 setup.py build_ext --inplace -j4 --with-debugging-symbols
Compiling pandas/_libs/algos.pyx because it changed.
Compiling pandas/_libs/arrays.pyx because it changed.
...
copying build/lib.linux-x86_64-cpython-310-pydebug/pandas/_libs/writers.cpython-310d-x86_64-linux-gnu.so -> pandas/_libs
copying build/lib.linux-x86_64-cpython-310-pydebug/pandas/io/sas/_sas.cpython-310d-x86_64-linux-gnu.so -> pandas/io/sas
copying build/lib.linux-x86_64-cpython-310-pydebug/pandas/_libs/json.cpython-310d-x86_64-linux-gnu.so -> pandas/_libs
root@90e75e54ee98:/data#
Your build should have completed without error. If you run into any issues with the compilation you can try reducing the parallel compilation by removing the -j4 flag; this will make your build take longer but should be stable (see issue #47305 for background information).
Timing read_csv with callgrind
With the build out of the way, we can now run our program under callgrind. To do this execute valgrind --tool=callgrind --callgrind-out-file=callgrind.out python3 -c "import pandas as pd; pd.read_csv('us_state_6digitnaics_2020.txt', encoding='cp1252')". This one command runs our read_csv call while being traced by callgrind, and writes the results of the trace to callgrind.out for us. Note that this adds some call overhead, so expect execution to be slower than normal.
By default the output from callgrind is not very readable. Interested readers can peruse the Callgrind Format Specification for a deeper understanding, but for this article we will use the callgrind_annotate command to inspect the output. This writes to stdout by default, so let’s run it to a pager like less via callgrind_annotate callgrind.out | less. The contents should look as follows:
--------------------------------------------------------------------------------
Profile data file 'callgrind.out' (creator: callgrind-3.18.1)
--------------------------------------------------------------------------------
I1 cache:
D1 cache:
LL cache:
Timerange: Basic block 0 - 3894679122
Trigger: Program termination
Profiled target:  python3 -c import pandas as pd; pd.read_csv('us_state_6digitnaics_2020.txt', encoding='cp1252') (PID 439, part 1)
Events recorded:  Ir
Events shown:     Ir
Event sort order: Ir
Thresholds:       99
Include dirs:
User annotated:
Auto-annotation:  on

--------------------------------------------------------------------------------
Ir
--------------------------------------------------------------------------------
14,377,625,638 (100.0%)  PROGRAM TOTALS

--------------------------------------------------------------------------------
Ir                      file:function
--------------------------------------------------------------------------------
3,070,417,258 (21.36%)  pandas/_libs/src/parser/tokenizer.c:tokenize_bytes [/data/pandas/_libs/parsers.cpython-310d-x86_64-linux-gnu.so]
1,156,873,554 ( 8.05%)  /clones/cpython/Objects/unicodeobject.c:_PyUnicode_CheckConsistency [/usr/local/bin/python3.10]
1,138,167,522 ( 7.92%)  ./string/../sysdeps/x86_64/multiarch/memset-vec-unaligned-erms.S:__memset_avx2_unaligned_erms [/usr/lib/x86_64-linux-gnu/libc.so.6]
  809,119,661 ( 5.63%)  /clones/cpython/Objects/unicodeobject.c:charmap_decode_string [/usr/local/bin/python3.10]
  578,399,204 ( 4.02%)  pandas/_libs/src/klib/khash.h:__ac_X31_hash_string [/data/pandas/_libs/parsers.cpython-310d-x86_64-linux-gnu.so]
  551,577,239 ( 3.84%)  pandas/_libs/src/parser/tokenizer.c:str_to_int64 [/data/pandas/_libs/parsers.cpython-310d-x86_64-linux-gnu.so]
  415,452,456 ( 2.89%)  pandas/_libs/src/parser/tokenizer.c:end_field [/data/pandas/_libs/parsers.cpython-310d-x86_64-linux-gnu.so]
  361,558,111 ( 2.51%)  pandas/_libs/parsers.c:__pyx_f_6pandas_5_libs_7parsers__string_box_utf8 [/data/pandas/_libs/parsers.cpython-310d-x86_64-linux-gnu.so]
  310,112,056 ( 2.16%)  /clones/cpython/Python/ceval.c:_PyEval_EvalFrameDefault'2 [/usr/local/bin/python3.10]
The first thing to note is the total number of Instructions Read (Ir) for the program, which comes out to 14,377,625,638 instructions. Towards the bottom of the above snippet we see the top three function calls are tokenize_bytes, _PyUnicode_CheckConsistency, and __memset_avx2_unaligned_arms. Those are listed at 3,070,417,258 then 1,156,873,554 then 1,138,167,522 instructions in total, respectively. The total instructions in the first column of each of these functions is followed by a relative percentage to the total Ir of the program.
The main function of interest to us will be the very first one, not only because it represents the largest amount of instructions, but also because it comes directly from our user code. The second function comes from _PyUnicode_CheckConsistency in the CPython standard library, and the third function comes from assembly code bundled with libc. While we may learn something from diving further into those, we have less control to change them than our user code.
At this point we know tokenize_bytes is where we spend the most time, but if you look at the source code you will see that it is a pretty big function. So how do we know where within this function we are spending our time?
Since we compiled our application with debug symbols, callgrind fortunately gives us line level profiling information further down in the file. Assuming you paged the callgrind_annotate output to less in the above command, input /tokenize_bytes and hit n to page through search results until you find the annotated function.
            .           int tokenize_bytes(parser_t *self,
        1,428 ( 0.00%)                     size_t line_limit, uint64_t start_lines) {
            .               int64_t i;
            .               uint64_t slen;
            .               int should_skip;
            .               char c;
            .               char *stream;
        1,224 ( 0.00%)      char *buf = self->data + self->datapos;
.
        1,224 ( 0.00%)      const char lineterminator = (self->lineterminator == '\0') ?
            .                       '\n' : self->lineterminator;
            .
            .               // 1000 is something that couldn't fit in "char"
            .               // thus comparing a char to it would always be "false"
        1,428 ( 0.00%)      const int carriage_symbol = (self->lineterminator == '\0') ? '\r' : 1000;
          612 ( 0.00%)      const int comment_symbol = (self->commentchar != '\0') ?
          612 ( 0.00%)              self->commentchar : 1000;
          612 ( 0.00%)      const int escape_symbol = (self->escapechar != '\0') ?
          612 ( 0.00%)              self->escapechar : 1000;
            .
        2,652 ( 0.00%)      if (make_stream_space(self, self->datalen - self->datapos) < 0) {
   19,380,953 ( 0.13%)  => pandas/_libs/src/parser/tokenizer.c:make_stream_space (204x)
            .                   int64_t bufsize = 100;
            .                   self->error_msg = malloc(bufsize);
            .                   snprintf(self->error_msg, bufsize, "out of memory");
            .                   return -1;
            .               }
            .
        1,224 ( 0.00%)      stream = self->stream + self->stream_len;
          612 ( 0.00%)      slen = self->stream_len;
The above snippet shows that every line in our source file is being annotated, along with the count / total percentage of Instruction Read event counts. You can use the f and b shortcuts to move forward and backwards through this source code, looking for lines that could be optimized. Paging through the output you will things like:
610,811,124 ( 4.25%)          switch (self->state) {
          .                       case START_FIELD_IN_SKIP_LINE:
          .                           if (IS_TERMINATOR(c)) {
          .                               END_LINE();
and
          .                               self->state = ESCAPED_CHAR;
445,004,236 ( 3.10%)                  } else if (IS_DELIMITER(c)) {
          .                               // end of field - end of line not reached yet
104,886,583 ( 0.73%)                      END_FIELD();
536,772,513 ( 3.73%)  => pandas/_libs/src/parser/tokenizer.c:end_field (6,169,799x)
These are indicators that the lines switch (self->state) {, { else if (IS_DELIMITER(c)) {, and the expansion of the END_FIELD(); macro (which inserts calls to end_field) take up 4.25%, 3.10% and 3.73% of your application runtime. Much of this has to do with the fact that these functions are invoked very often, so while they may not be slow in a traditional sense, you as a developer may decide that you need to still find a faster way to implement these.
Where to go from here
For those interested in a more visual representation of their profile than what callgrind_annotate can offer, the KCachegrind tool may prove very useful. Here is what the profile we created above would look like when opened within that tool:
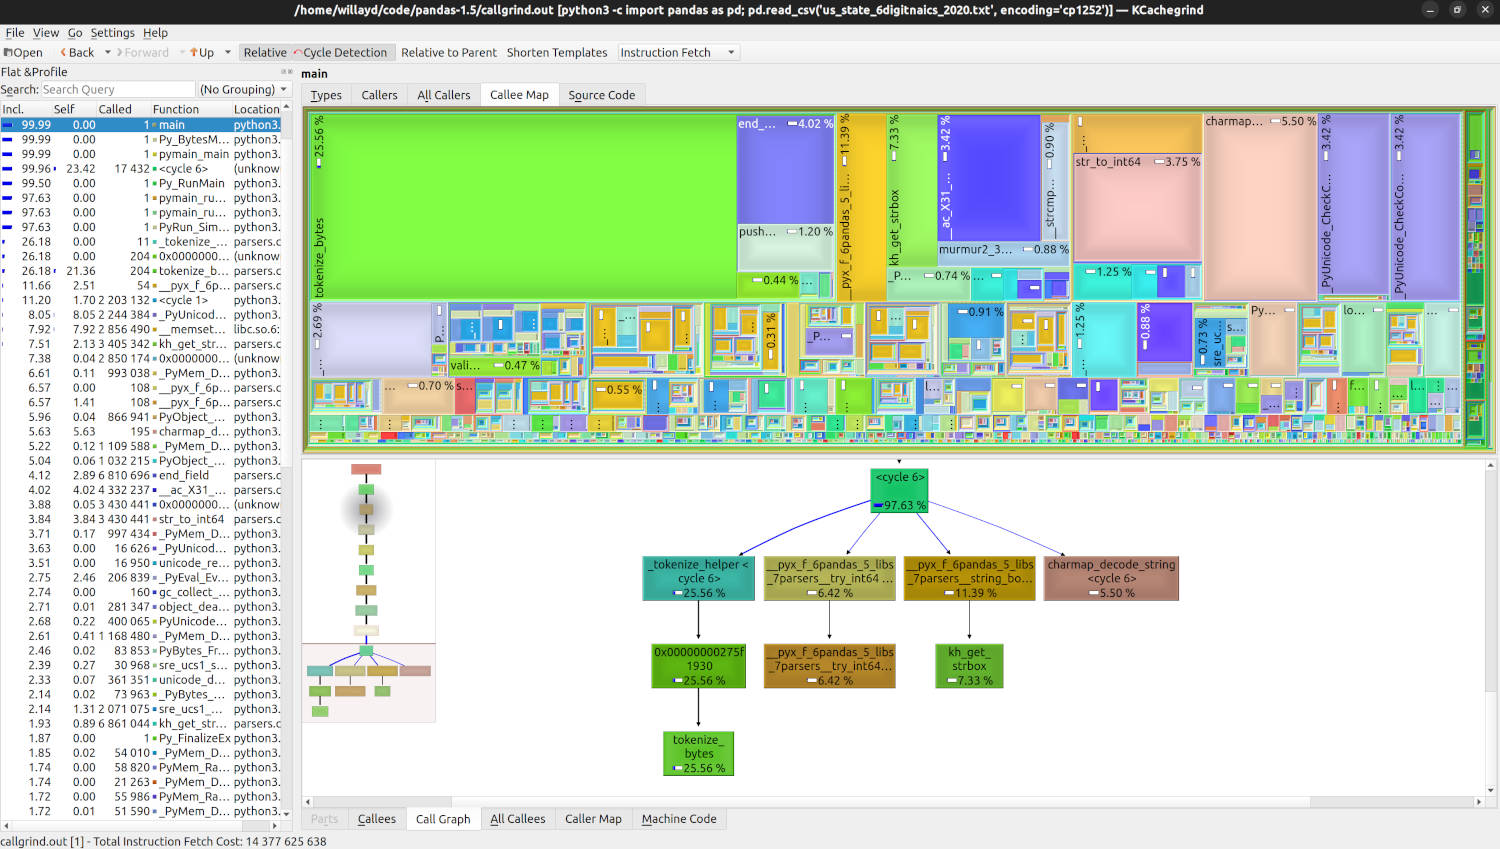
In the real world you will also want to profile a few different input files. We only went over the single US Census source file in this article, but you may be surprised to see different file sizes and contents yield different bottlenecks within your application.
While the above steps are easy for beginners, once you have your bearings you also likely want to do a release build with debug symbols. Refer to your build system on how to best accomplish this. The things that are bottlenecks when built solely in debug mode may disappear when you build a release build as optimizations the compiler can apply will significantly impact code execution.
As a final note, this article showed you how to identify potential bottlenecks within your application, without offering a point of view on how to fix them. In a future article we will dive into using tools like godbolt or gdb to view the assembly generated by our functions, which would be helpful to understand at a low level and yield insights on optimizations we may be able to make.